Standard Laboratory Test Methods for Paperboard Physical Property Verification
Paperboard physical property verification requires strict ISO 187 conditioning and standardized test methods to ensure compliance and prevent customs holds.
Atmosphere
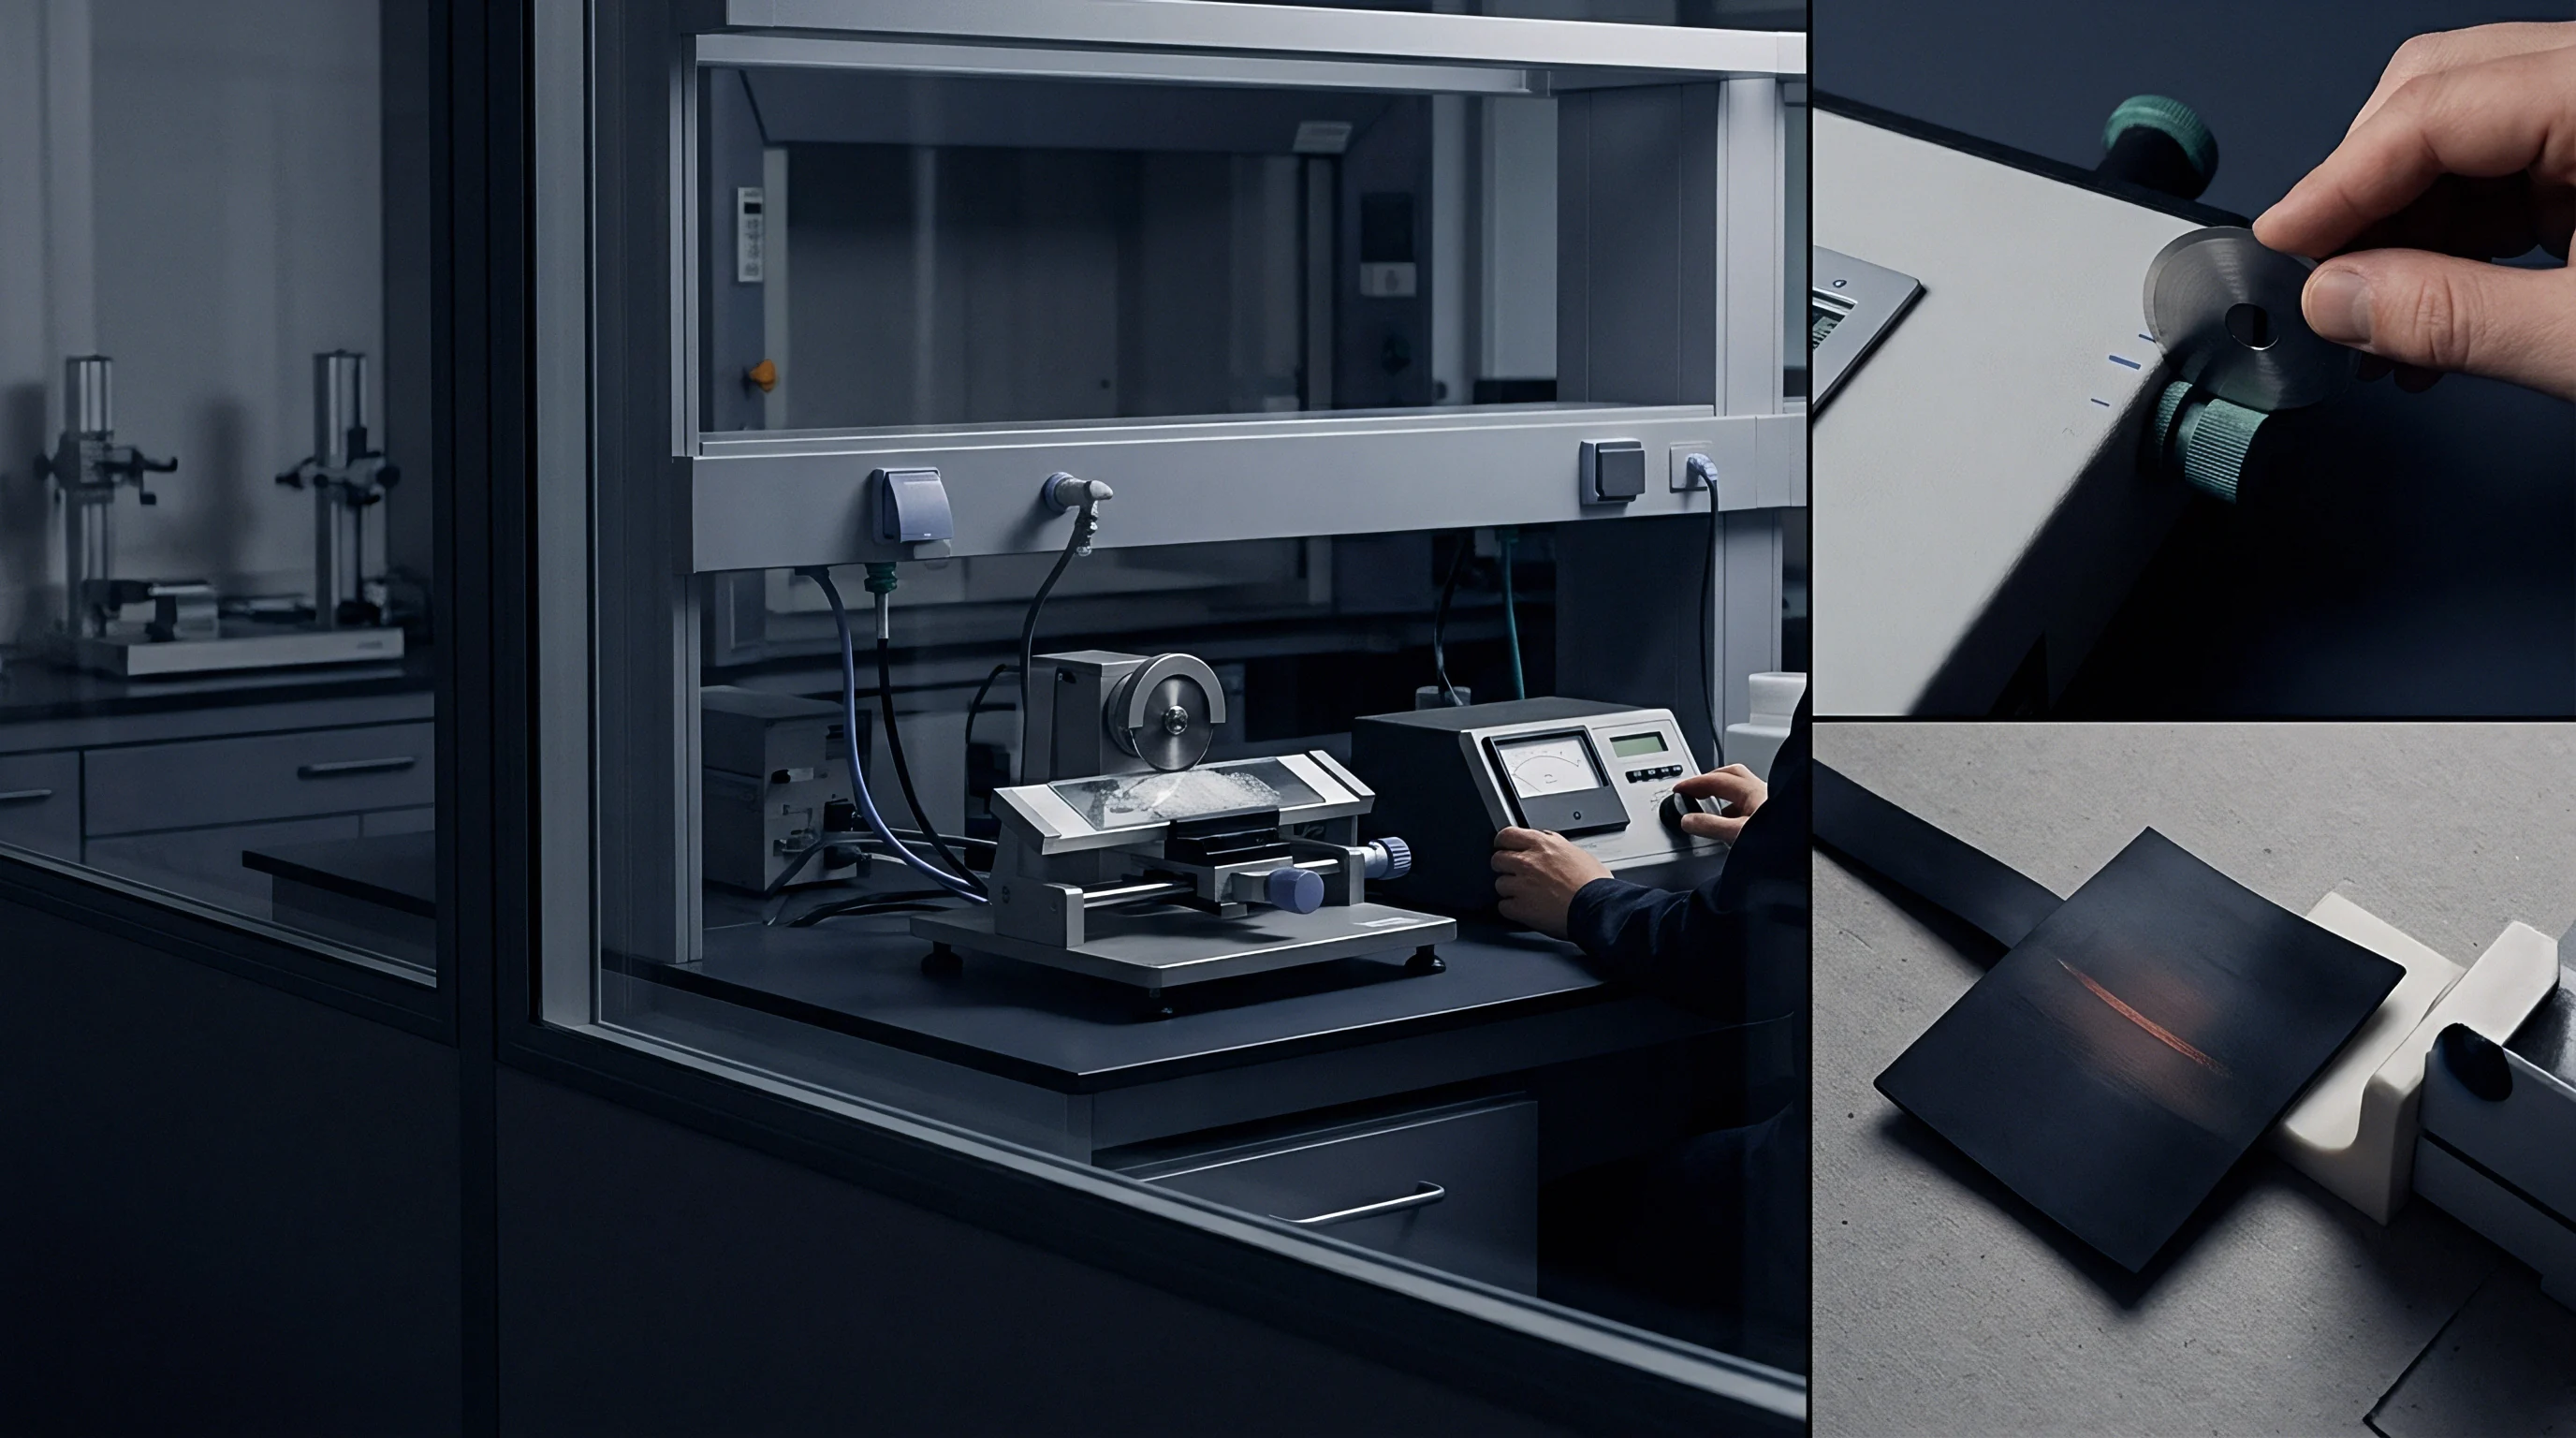
Paperboard testing relies on strict relative humidity and temperature control to yield repeatable physical data across testing facilities. Because cellulose fibers are hygroscopic, they continuously exchange moisture with the surrounding atmosphere, altering internal hydrogen bonding, fiber volume, and the sheet’s viscoelastic behavior. Minor shifts in ambient humidity quickly distort physical strength results, making unconditioned test reports useless for commercial verification.
Standard Conditioning Environment under ISO 187
Cellulose fibers absorb water vapor until their internal moisture reaches dynamic equilibrium with the air. Under ISO 187 and TAPPI T 402, standard atmospheric conditions are set at 23.0 °C ± 1.0 °C and 50.0% ± 2.0% relative humidity. Certain tropical shipping routes reference an alternative standard of 27.0 °C ± 1.0 °C and 65.0% ± 2.0% relative humidity, but baseline contract verification adheres to 23 °C / 50% RH.
Specimen conditioning must continue until weight stabilizes, requiring 24 hours for individual sheets and up to 48 hours for heavy boxboard or laminated grades.
Mechanical properties shift rapidly during the initial exposure phase as fibers absorb moisture. Tensile strength and bending stiffness drop as moisture content climbs, whereas burst strength and tear resistance show non-linear responses tied to refining levels and internal sizing chemistries.

Equilibrium Hysteresis and Fiber Sorption Dynamics
Sorption dynamics follow two distinct paths depending on whether dry fiber takes on humidity or wet stock dries out. The equilibrium moisture content of a dry sample brought up to 50% relative humidity is lower than that of a moist sample brought down to the same 50% RH environment. This hysteresis gap creates an offset of 0.5% to 1.5% in total moisture content, enough to generate noticeable discrepancies during strength verification.
To eliminate hysteresis errors, ISO 187 requires pre-conditioning test specimens for at least 24 hours between 20% and 35% relative humidity at a maximum temperature of 40 °C. Pre-conditioning forces all test samples to approach final equilibrium along the adsorption curve (from the dry side), stabilizing moisture uptake and ensuring reproducible strength data.
| Relative Humidity (%) | Equilibrium Moisture (%) | Taber Bending Stiffness (mN·m) | Short-Span Compression SCT (kN/m) | Mullen Burst Strength (kPa) |
|---|---|---|---|---|
| 30.0 (Pre-conditioned dry) | 4.8 | 24.5 | 8.2 | 610 |
| 50.0 (Standard ISO 187) | 6.5 | 21.0 | 7.4 | 580 |
| 65.0 (High humidity ambient) | 8.9 | 17.2 | 6.1 | 535 |
| 80.0 (Tropical transport) | 12.4 | 12.8 | 4.5 | 450 |
| Data based on virgin bleached sulphate folding boxboard conditioned from adsorption path at 23 °C. | ||||
Conditioning virgin folding boxboard at sixty-five percent relative humidity increases equilibrium moisture content by two point four percent and reduces two-point bending stiffness by eighteen percent compared to standard laboratory equilibrium at fifty percent relative humidity.
Testing paperboard pulled straight from an unconditioned shipping container without proper pre-conditioning compromises stiffness and compression values, leading to erroneous batch rejections or carton collapse on high-speed packaging lines.

Grammage
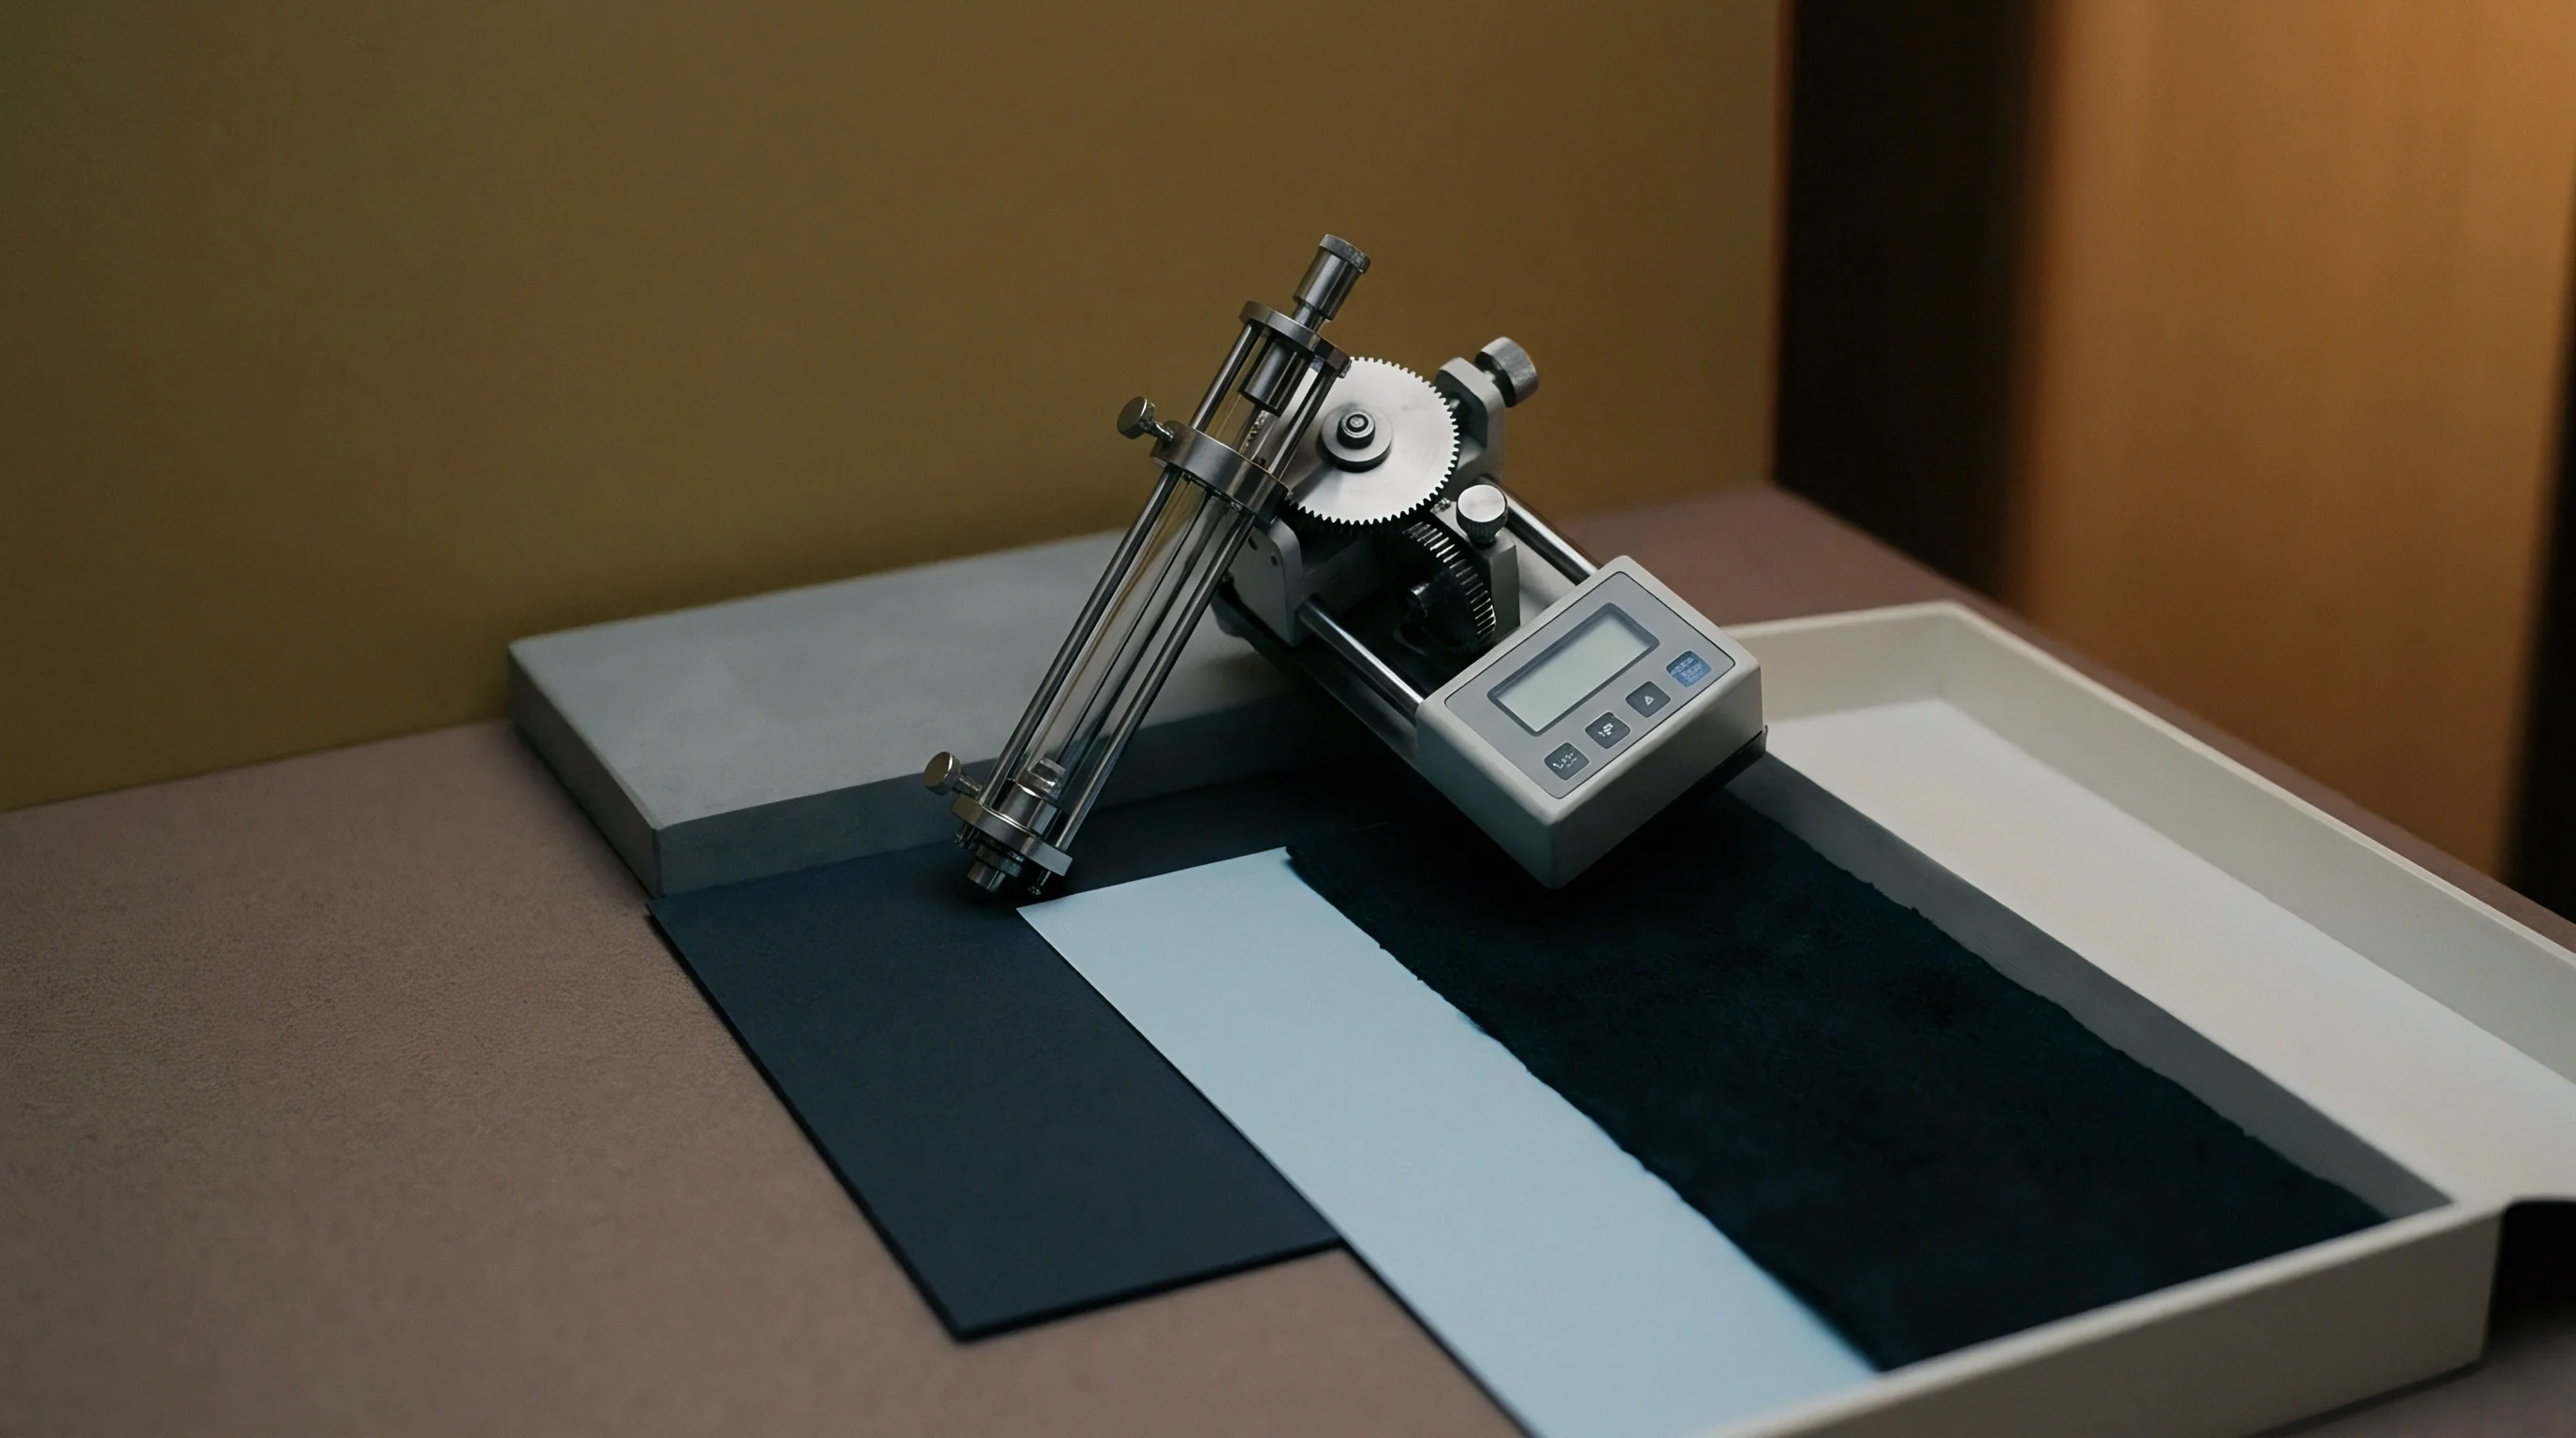
Mass per unit area is the primary commercial metric for paperboard valuation, determining structural performance when evaluated alongside caliper. While paperboard is traded on basis weight, mechanical behavior depends directly on how those grams of fiber are distributed through the sheet’s cross-section.
Precision Mass Determination Methods
Analytical balances record specimen mass after samples are cut to size using precision die cutters or punch templates. ISO 536 and TAPPI T 410 govern the standard determination of grammage. Cutting tools must yield clean, parallel edges without tearing fiber, maintaining a minimum test area of 100 cm² (or 500 cm² for higher precision).
Analytical balances must read to a resolution of 0.001 g.
Grammage (g) in grams per square meter (g/m²) is calculated from specimen mass (m) in grams and surface area (A) in square centimeters:
g = fracmA × 10000
Moisture testing per ISO 287 runs alongside grammage determinations to verify oven-dry basis weight whenever contracts specify moisture-free fiber mass.
- Cut ten test specimens measuring exactly 100 square centimeters from representative sample sheets chosen per ISO 186 sampling guidelines.
- Condition specimens at 23 °C and 50 percent relative humidity following pre-conditioning below 35 percent relative humidity.
- Weigh each specimen on a calibrated analytical balance with a resolution of 0.001 grams and record individual mass values.
- Calculate average mass per unit area by multiplying mean specimen mass by one hundred to express results in grams per square meter.
- Dry specimens in a ventilated oven at 105 °C to constant mass to calculate moisture content and dry basis grammage under ISO 287.
Micro-Caliper Calibration and Pressure Dynamics
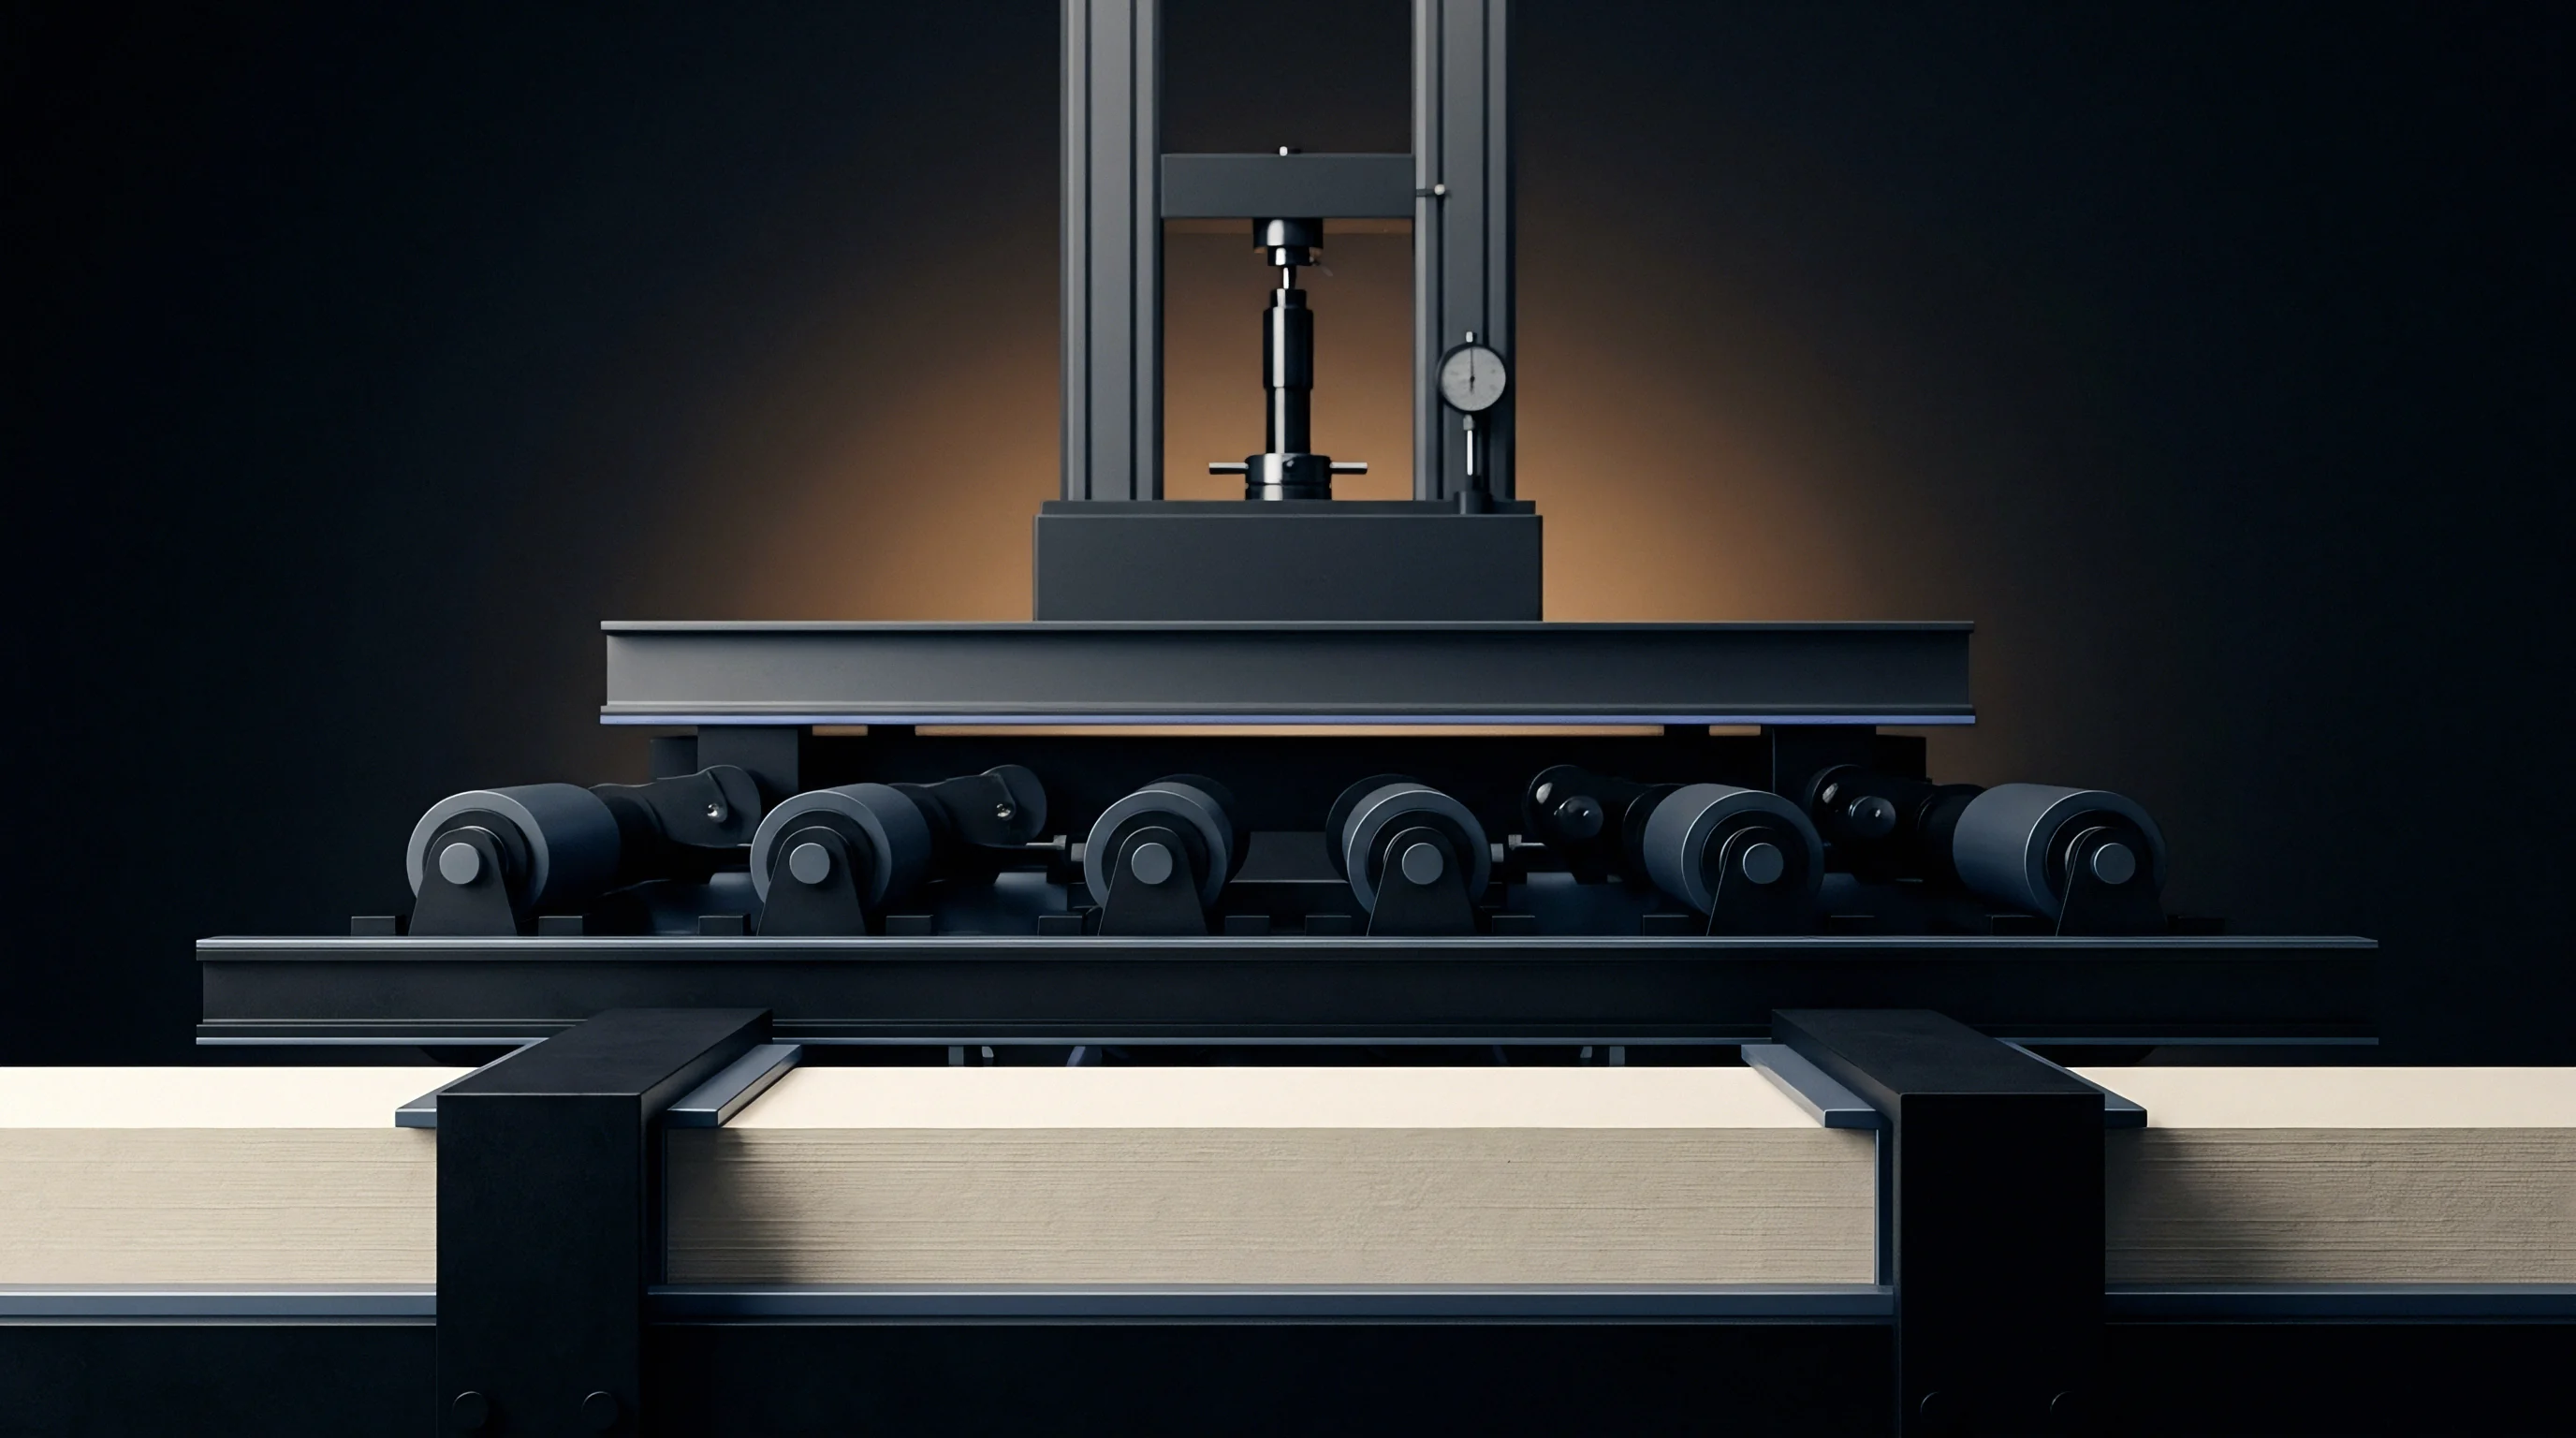
Motorized micrometers measure single-sheet thickness by applying a controlled platen load that avoids crushing internal voids. Caliper verification under ISO 534 and TAPPI T 411 mandates a static contact pressure of 50 kPa ± 5 kPa across circular, parallel anvils with an area of 200 mm². The lowering speed of the upper platen is held at 2.0 mm/s ± 0.5 mm/s to prevent impact damage on contact.
Apparent sheet density (ρ) in g/cm³ and apparent specific volume or bulk (v) in cm³/g are calculated by pairing grammage (g) in g/m² with measured caliper (d) in micrometers (µm):
ρ = fracgd
v = fracdg
A worked comparison demonstrates the practical effect of bulk: a 350 g/m² Solid Bleached Board (SBB) with a measured caliper of 420 µm gives an apparent density of 0.833 g/cm³ and a bulk of 1.20 cm³/g. A Coated Recycled Board (CRB) of the same 350 g/m² basis weight yielding a caliper of 490 µm has a bulk of 1.40 cm³/g. The 16.7% higher bulk of the CRB delivers comparable bending stiffness at lower fiber density, while the denser SBB retains higher tensile strength and a smoother surface for fine graphic printing.
Caliper shortfalls below specification often trace back to uncompensated press section wear on the paper machine rather than raw furnish variations.


Clamp
Pneumatic clamping in hydraulic burst testing secures the board to force clean tensile failure across the test area. The Mullen burst test remains a core packaging benchmark, measuring multi-directional tensile resistance under hydraulic strain.
Hydraulic Burst Testing and Diaphragm Calibration
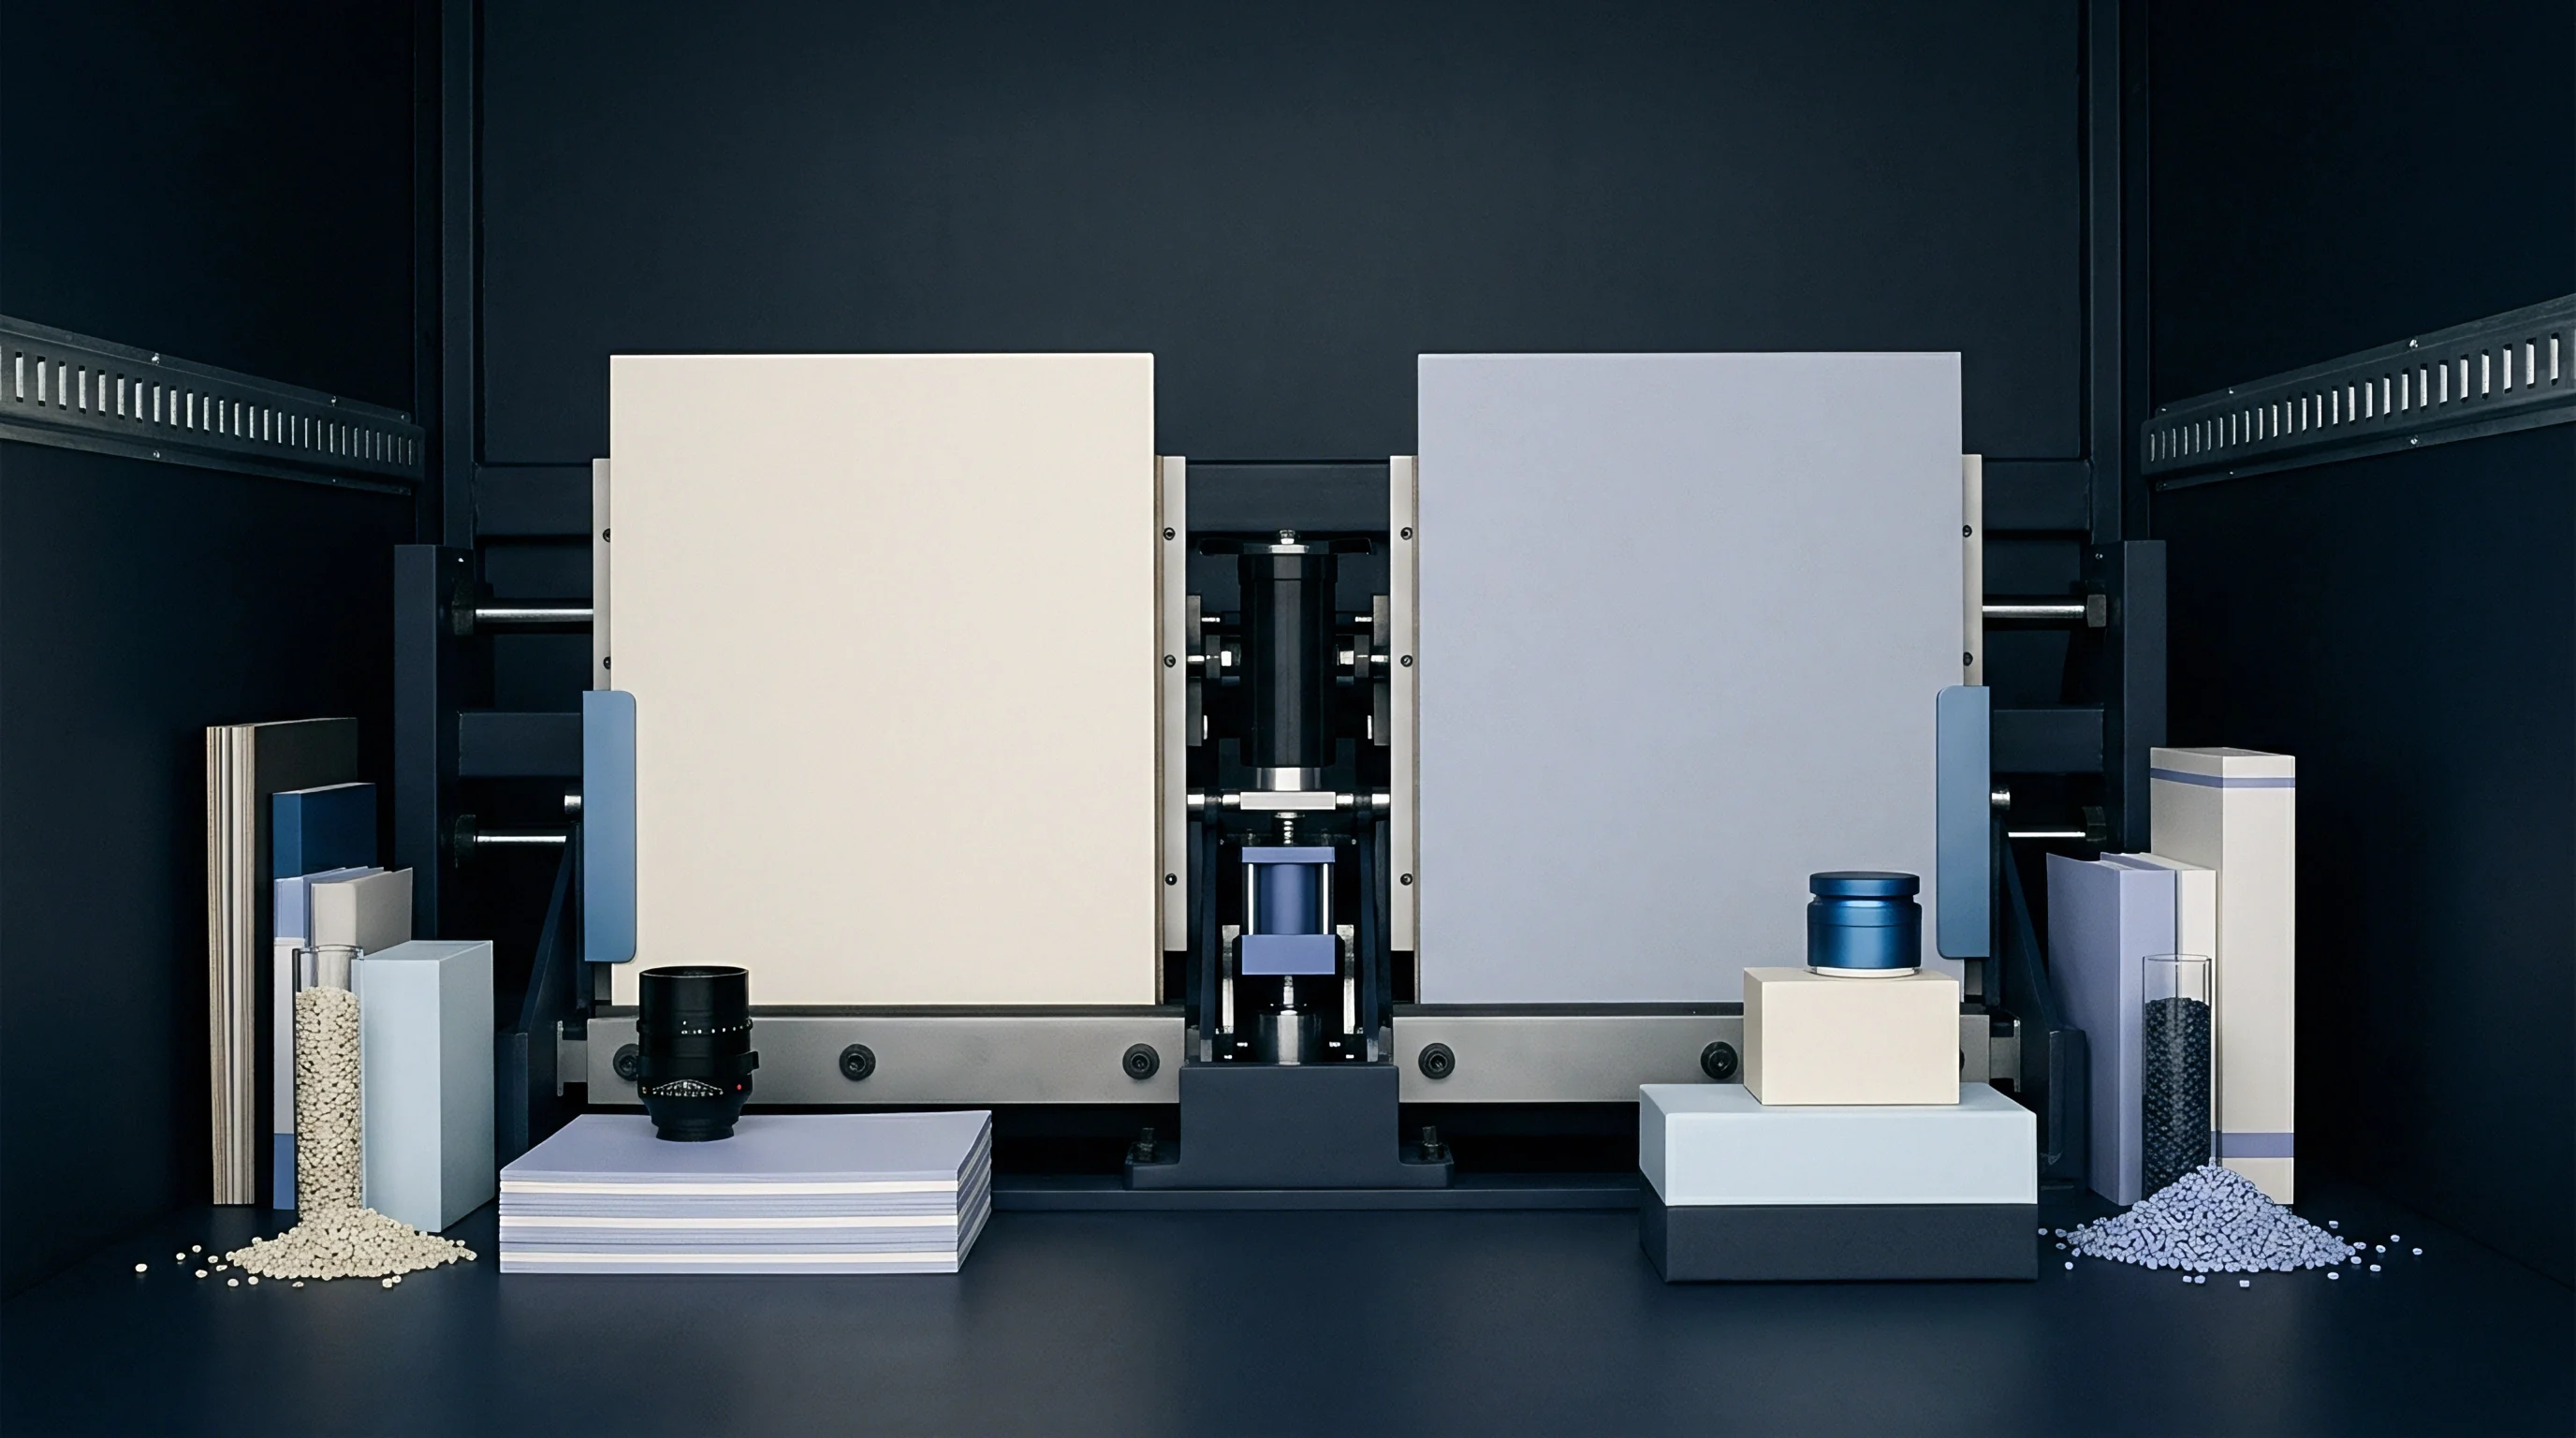
Mullen testers inflate an elastic diaphragm through an annular clamp until the circular board area bursts under pressure. ISO 2759 governs paperboard bursting strength for materials with burst values between 350 kPa and 5500 kPa; ISO 2758 covers lighter papers below 350 kPa. Glycerin is pumped behind the diaphragm at a constant displacement rate of 170 ml/min ± 15 ml/min.
Diaphragm condition affects peak pressure readings directly. Resistance must be checked regularly by verifying free distension height: a board-testing diaphragm should bulge 9.0 mm above the lower clamp face at a pressure between 170 kPa and 220 kPa. Hardened or aged rubber absorbs excessive hydraulic force, artificially boosting recorded burst values.

Pneumatic Gripping Forces and Edge Shear
Securing the specimen requires balancing slip prevention against fiber crushing along the clamp ring. Pneumatic pressure on the upper and lower annular rings must keep the sample from slipping as the diaphragm inflates, without cutting surface fibers at the perimeter. ISO 2759 sets clamping pressures between 700 kPa and 1200 kPa for heavy board grades.
Low clamping force permits the outer plies to draw inward toward the test aperture, yielding falsely elevated pressure peaks alongside a telltale double-burst sound. Excessive pressure crushes the edges, causing early shear failure right along the clamp perimeter.
- Annular Edge Shear occurs when excessive holding force cuts surface fibers along the specimen ring boundary before peak pressure develops.
- Specimen Slippage appears when inadequate ring pressure lets board draw into the test aperture, generating artificially elevated pressure peaks.
- Diaphragm Resistance Error results from age-hardened rubber membranes that consume uncalibrated hydraulic pressure during extension.
- Double Rupture Signatures indicate sequential ply failure in multi-layer board caused by uneven tension distribution during expansion.
Clause 4.2 of ISO 2759 rejects any bursting strength test report where specimen slippage under the clamping ring exceeds zero point two millimeters during hydraulic pressurization.
Over-tightening clamps until visible impression marks form around the ring boundary skews results downward by inducing premature perimeter shear.
Flexure
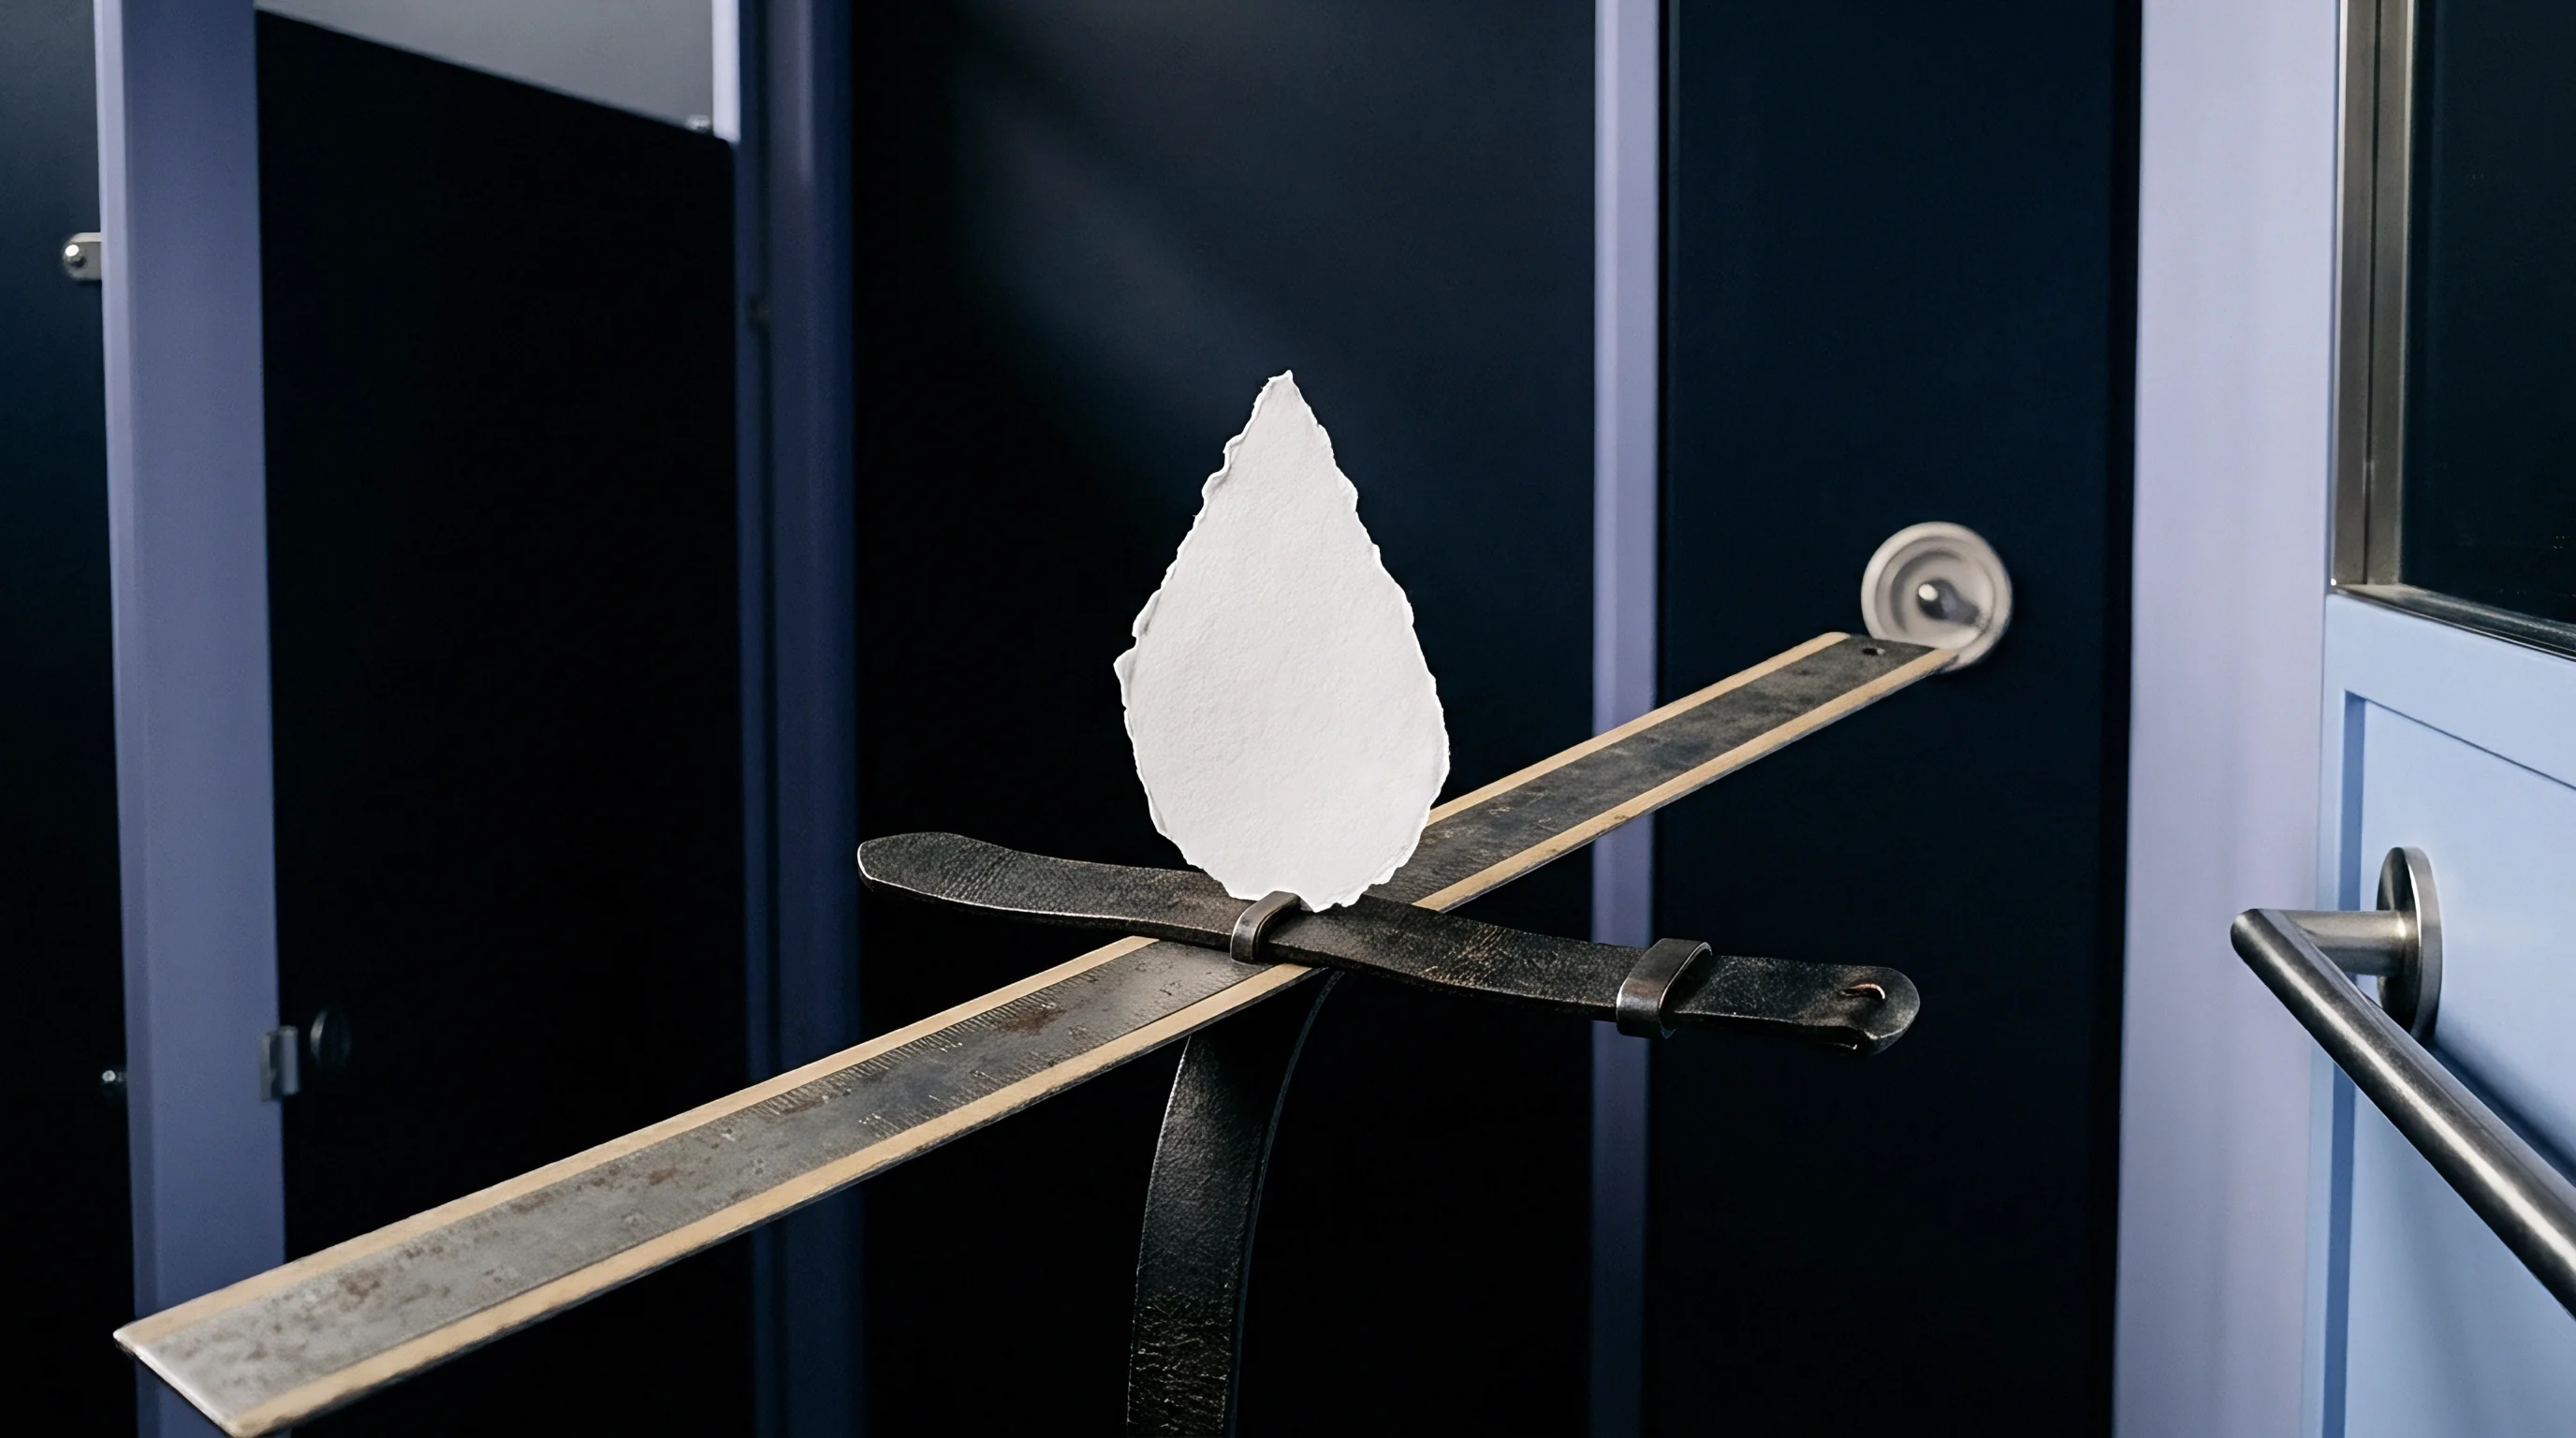
Bending stiffness dictates how well folding cartons and corrugated containers hold their shape during stacking and high-speed packaging runs. Adequate stiffness keeps carton panels from bowing under compression and maintains squareness during carton erection.
Why Do Laboratory Stiffness Measurements Shift between Operating Methods?
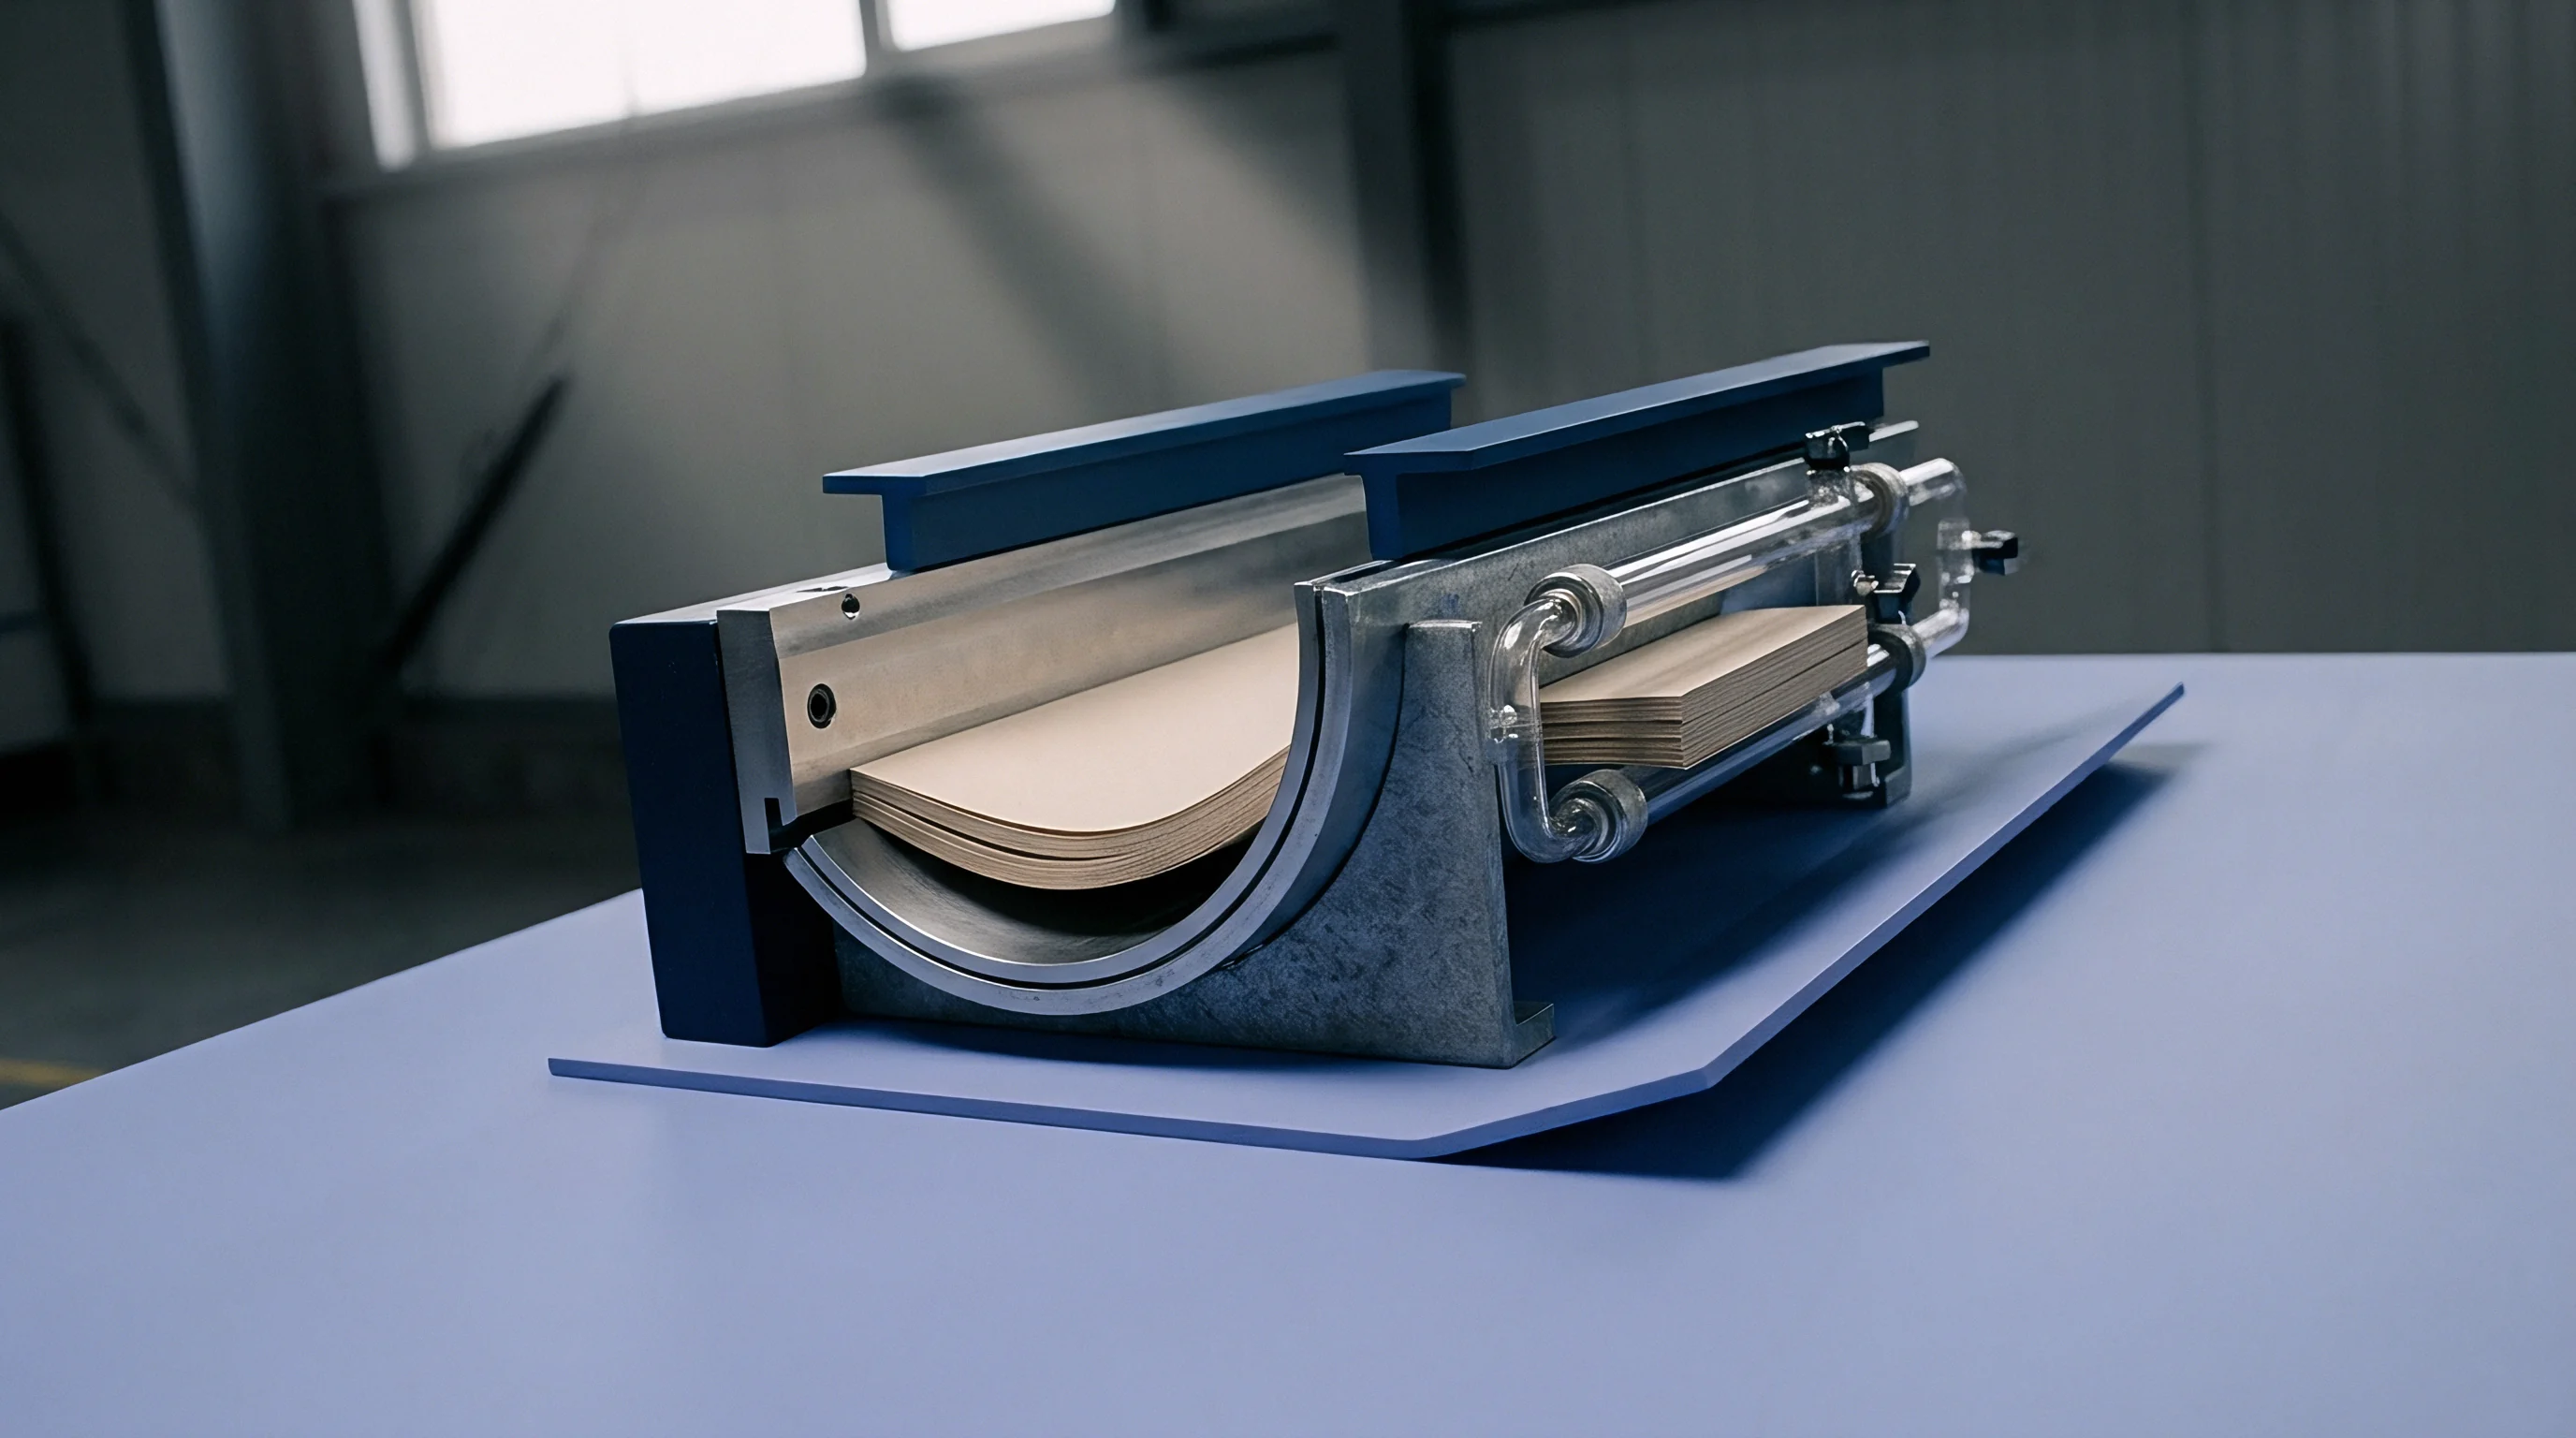
Differences in measured stiffness stem from variations in bending angle, span length, and load geometry among test instruments. ISO 2493-1 specifies a 2-point method using a 15° deflection angle over a 50 mm length, while ISO 2493-2 defines Taber stiffness using a 15° arc over a 50 mm width and a 38 mm or 50 mm span. Resonance methods under ISO 5629 measure dynamic vibrational response without mechanical clamping.
Machine Direction (MD) stiffness routinely exceeds Cross Direction (CD) stiffness due to fiber orientation during wet-end sheet formation. In continuous multi-ply folding boxboard, MD/CD stiffness ratios generally sit between 1.8 and 2.5.
Taber versus L&W Bending Resistance Mechanics
Two-point bending fixtures hold one end of the specimen while a motorized roller applies load at the free edge. Taber stiffness values in milliNewton-meters (mN·m) or Taber Units (ST) relate directly to L&W 15° bending resistance (F15) in milliNewtons (mN) through geometric conversion factors:
ST = fracF15 × L × sin(15circ)π / 12
where L is the bending span (50 mm). Applying incorrect conversion formulas or comparing 7.5° test data directly against standard 15° measurements leads to disputes during material qualification.
Crease Recovery and Score Bend Verification
Converting operations require scoring paperboard to produce clean, sharp folds without cracking top liner plies or creating excessive folding resistance. Crease stiffness testing under TAPPI T 829 and ISO 9895 measures the residual bending force of a scored line folded to 90°. The ratio of creased bending force (Fc) to uncreased board stiffness (Fu) gives the crease factor (CF):
CF = fracFcFu × 100%
Target crease factors generally fall between 30% and 50%. A factor above 60% indicates an under-creased score, leading to panel bowing and jams in automated folder-gluers. A crease factor below 20% points to severe fiber fracturing along the score line, compromising carton corner strength under stack loads.
| Method Standard | Instrument Type | Bending Angle (°) | Test Span (mm) | Specimen Width (mm) | Primary Yield Units |
|---|---|---|---|---|---|
| ISO 2493-1 | L&W 2-Point Stiffness Tester | 15.0 | 50.0 | 38.0 | milliNewtons (mN) |
| ISO 2493-2 | Taber V-5 Stiffness Tester | 15.0 | 38.0 or 50.0 | 38.1 | mN·m or Taber Units |
| TAPPI T 556 | Pneumatic Bending Resistance | 15.0 or 7.5 | 50.0 | 38.0 | milliNewtons (mN) |
| TAPPI T 829 | Score Bend / Crease Tester | 90.0 | 12.7 | 25.4 or 38.0 | milliNewtons (mN) |
Cross-direction stiffness dictates carton wall bulge under load, while machine-direction stiffness determines line speed through high-speed folder-gluers.
- Permanent Crease Shear occurs when scoring knives crush internal plies without clean fiber displacement, causing uneven carton squareness.
- Crease Springback Resistance measures residual torque in folded flaps that forces carton end closures open after adhesive application.
- Asymmetric Plies Failure develops in multi-layer board when outer liner tension exceeds inner ply compressive strength during 15-degree bending.
Section 6.3 of TAPPI T 556 invalidates stiffness data obtained from specimens containing visible score lines or watermarks within the 50-millimeter bending span, changing acceptance boundaries for converted board samples.
Bond
Internal bond strength measures the energy needed to delaminate multi-ply paperboard along its interior fiber layers during printing and converting. Low ply-bond strength permits offset ink tack to pick fibers from the surface or causes sheet delamination during high-speed scoring and folding.
Internal Delamination Resistance via Scott Bond
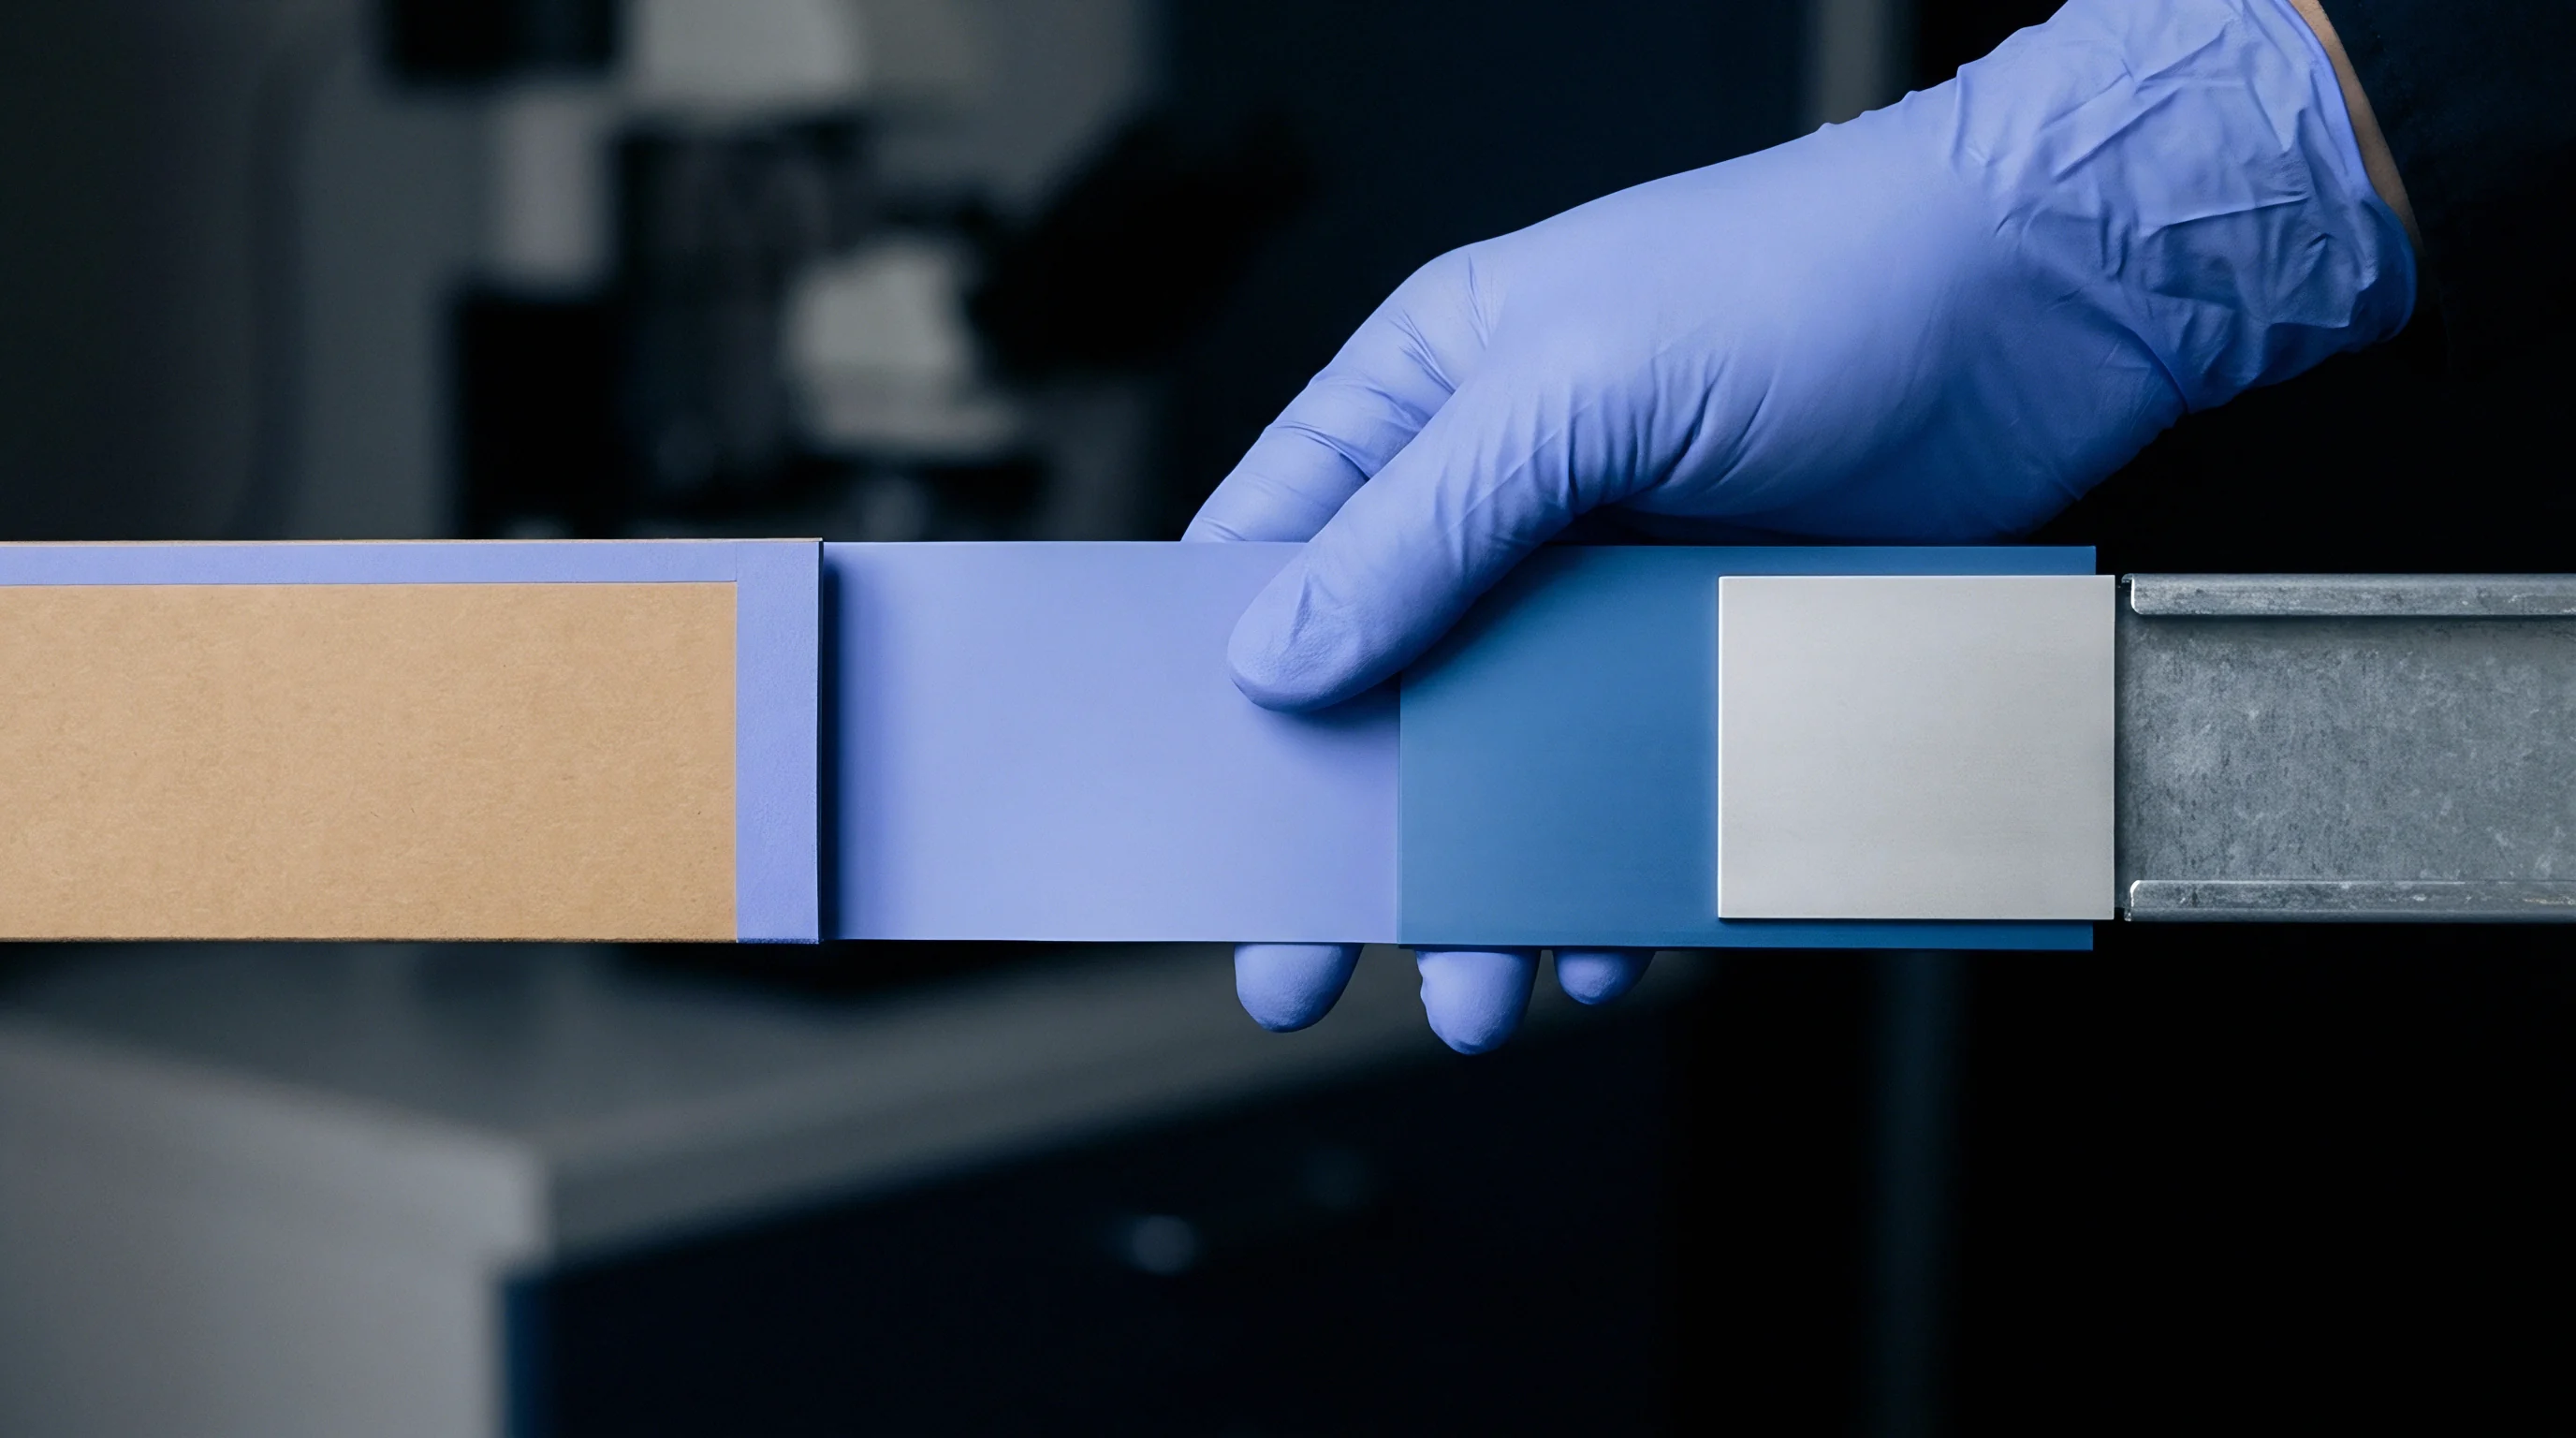
Impact testing under ISO 16260 and TAPPI T 569 uses a falling pendulum to strike an aluminum angle bonded to the specimen surface. Double-sided adhesive tape fixes the sample between a rigid base and the aluminum block. A dedicated preparation press consolidates the sandwich under 0.7 MPa to 1.4 MPa of pressure for 3 seconds.
Released from its 90° starting position, the pendulum hits the upright face of the aluminum angle, cleaving the paperboard along its weakest Z-directional internal interface. Energy loss is recorded in Joules per square meter (J/m²). Standard Scott Bond figures range from roughly 150 J/m² for bulky Coated Recycled Board (CRB) to over 350 J/m² for virgin Solid Bleached Sulphate (SBS) boards.
Short-Span Compression and Z-Directional Tensile Limits
Measuring axial compression across a very short gap isolates fiber compressive strength from structural buckling. Short-Span Compressive Strength (SCT) testing under ISO 9895 and TAPPI T 826 clamps a single sheet between pneumatic jaws separated by a 0.70 mm ± 0.05 mm span. A clamping load of 2300 N ± 50 N keeps the sheet flat, ensuring pure compressive failure across the free span.
SCT figures in kiloNewtons per meter (kN/m) provide the primary input for McKee’s formula when calculating corrugated box compression test (BCT) values. Perpendicular tensile testing under ISO 15754 applies direct Z-direction tension through glued metal blocks, recording ultimate surface delamination resistance in kiloPascals (kPa).
- Adhesive Tape Failure occurs when double-sided mounting tape delaminates from the aluminum anvil before fiber rupture develops.
- Compression Over-Consolidation alters Scott Bond values when excessive specimen preparation pressure compacts soft recycled fibers.
- Z-Direction Tension Shear introduces off-axis forces during perpendicular tensile testing if pulling jaws lack precise alignment.
- Short-Span Micro-Buckling degrades SCT compression values when specimen clamping jaws contain oil residue or surface wear.
Whether high-speed Scott Bond impact tests accurately reflect slow delamination stress experienced by heavy board cartons during prolonged stacking remains a subject of ongoing laboratory investigation.


Tolerance
Statistical acceptance sampling connects bench test results with commercial contract terms when clearing inbound shipments at import terminals. Physical property test records serve as baseline evidence for compliance under purchase contracts and environmental packaging mandates.

Statistical Batch Verification and Acceptance Sampling
Representative sampling under ISO 186 or TAPPI T 400 requires taking random sample units across an entire production lot to build a valid composite test set. The number of sampling units (n) is determined by lot size (N):
n = 0.5 × sqrtN
Individual property checks should demonstrate a process capability index (Cpk) above 1.33 to confirm that lot variation remains safely within purchase specifications. When evaluating test values against contractual thresholds, standard deviation calculations determine whether a shipment passes inspection or triggers commercial adjustment.
Verification Dossier Construction for Regulatory Compliance
Importers maintain physical test data alongside chain-of-custody documentation to satisfy packaging minimisation rules under European Union Packaging and Packaging Waste Regulation (PPWR) requirements. These rules require documented proof that grammage and caliper represent the lowest structural mass necessary to protect the product. Specifying heavier board than functional performance requires creates liability under over-packaging rules.
| Physical Property | Primary Test Standard | Alternative Standard | Typical Commercial Tolerance | Failure Consequence |
|---|---|---|---|---|
| Grammage (Mass/Area) | ISO 536 | TAPPI T 410 | ± 3.0 % of target g/m² | Invoicing adjustment or lot rejection |
| Caliper (Thickness) | ISO 534 | TAPPI T 411 | ± 5.0 % of specified µm | Feeder jams and folder-gluer misalignments |
| Bending Stiffness | ISO 2493-1 | TAPPI T 556 | ± 10.0 % of minimum MD/CD | Carton panel bulging and stacking collapse |
| Bursting Strength | ISO 2759 | TAPPI T 807 | – 10.0 % maximum lower limit | Puncture failure during transport handling |
| Short-Span Compression | ISO 9895 | TAPPI T 826 | – 8.0 % maximum lower limit | Corrugated box compression failure |
| Internal Bond (Scott) | ISO 16260 | TAPPI T 569 | – 12.0 % maximum lower limit | Print surface picking and ply splitting |
A mill test certificate documenting compliance at origin fails to protect an importer when physical property degradation occurs during transit under uncontrolled ambient conditions.
Demonstrating that board shipments meet both structural requirements and packaging minimisation rules requires complete test files linked directly to the reel numbers and production batch codes listed on the commercial invoice.